Color Graphs of Complex Functions |
||
|---|---|---|
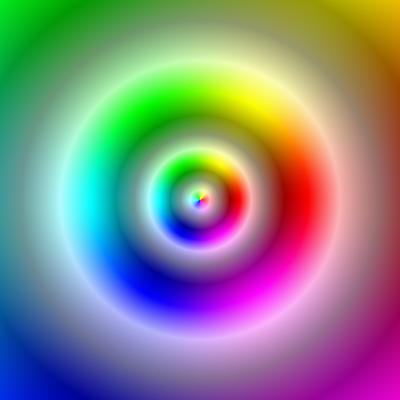
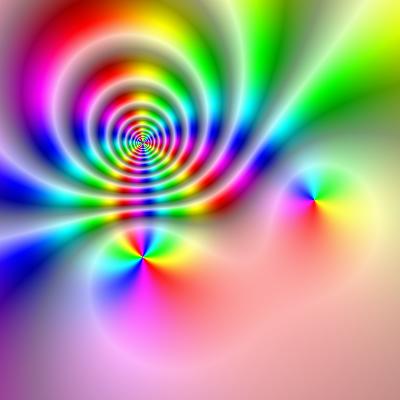
It is easy to set up a correspondence between the argument of a complex number and the hue of a color since both are measured as angles. We use red to mean argument 0 (or 360) degrees; green means 120 degrees, and blue means 240 degrees. I have been using contour lines in saturation and value to represent the modulus of the complex value. The contours distinguish moduli between 0 and 1, and between 1 and e, and e and e2, etc. Moduli between 0 and 1 (or any of these ranges) are essentially wrapped around a rectangle in saturation-value space with one corner at saturation = 1 and value = 1, and the opposite corner at saturation = 0.3 and value = 0.6. See Visual Basic code (.txt file). The function f(z) = z is plotted to the left below. The contours appear as ridges with a shadow on the high modulus side. Zeros always have a pinwheel of color, red to green to blue in a counterclockwise direction. For a simple zero there is one cycle of color; for a double zero two cycles, etc. To the right below is a plot of a function with a simple zero, a double zero, and a triple pole. Colors cycle in the reverse order around a pole, and there is always a set of modulus contours approaching the pole. |
||
 |
 |
|
| The plot to the right is the square root of the function above it, and shows several branch cuts. | 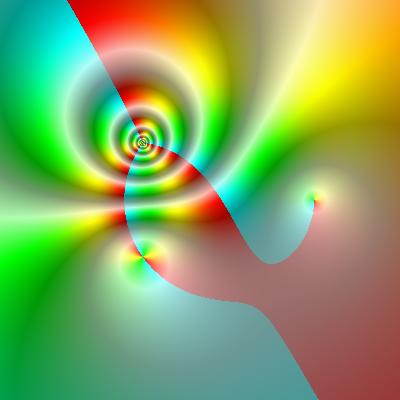 |
|
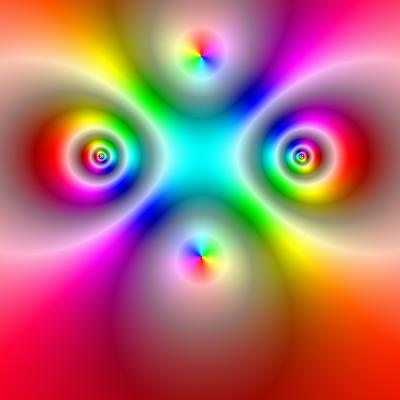
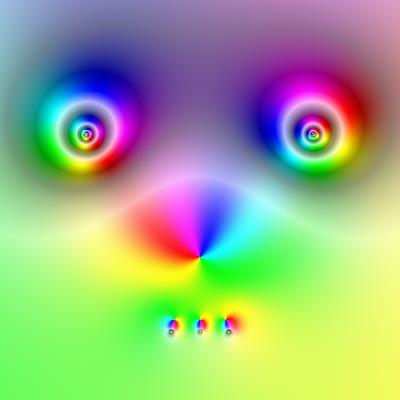
| The left plot below is of the function f(z) = (z2 + 1)/(z2 - 1). The 'eyes' are poles, and the muzzle and forehead are zeros. The plot on the right was carefully constructed with poles for eyes, and a zero for a nose. The three teeth each consist of a zero just above a pole. | ||
 |
 |
|
| Where to go next: | ||
| A Gallery of G
Functions To see some very complicated
graphs of complex valued functions
Alternatives To see an alternate method of plotting complex valued functions Larry Crone Home Page AU Mathematics and Statistics |
||